SMaRT Analytics™
What is SMaRT Analytics for Healthcare Operational Intelligence?
SMaRT Analytics is a software-as-service (SaaS) data visualization platform for healthcare organizations of all sizes. SMaRT Analytics standardizes and streamlines healthcare operations and financial data into a single unified source, transforming it into easy-to-understand, actionable information.
This next evolution in healthcare business intelligence is a complete solution that enables healthcare leaders to quickly answer their most pressing questions and rely much less on analysts for answers.
Ask SMaRT Analytics™ Anything.
In as little as 45 days, Sixth Sense’s proprietary SMaRT Analytics™ platform delivers immediate ROI with unparalleled insight into thousands of questions all healthcare executives are asking.
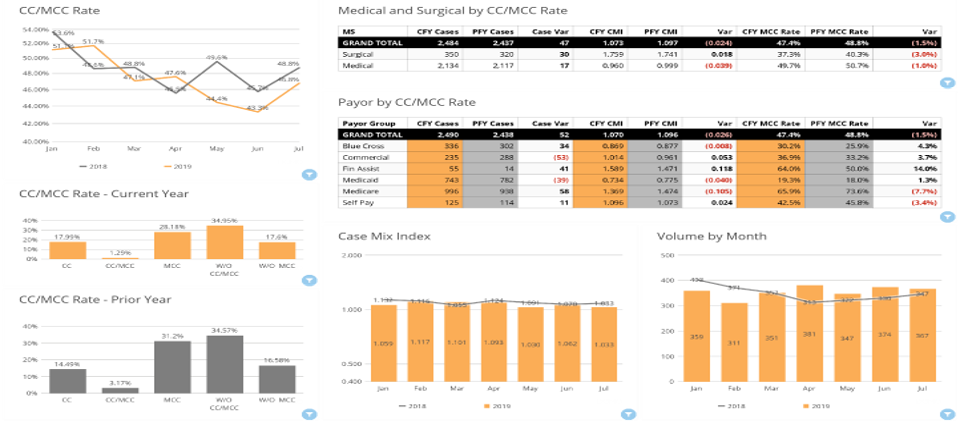
Your CMI Dashboard does the work for you!
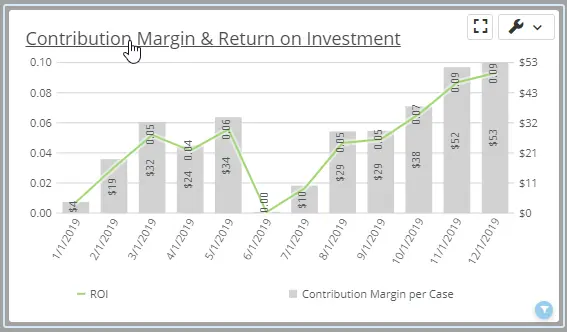
Your Profitability Dashboard does the work for you!
Your Revenue Trending does the work for you!
Your Physician Variation Dashboard does the work for you!
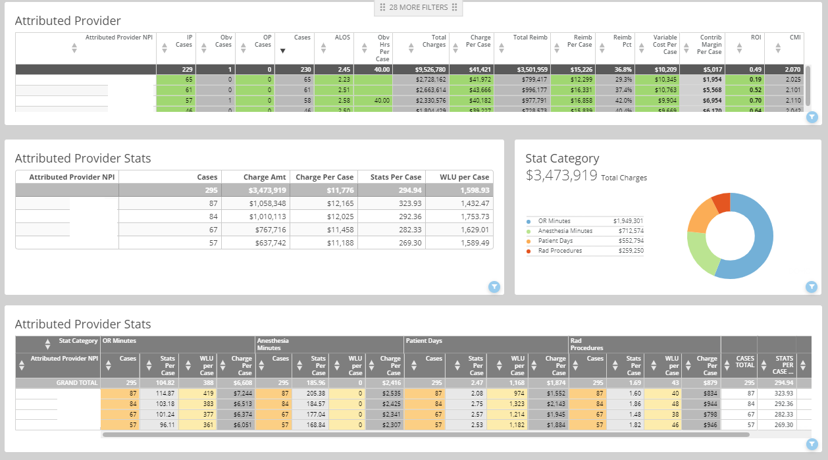
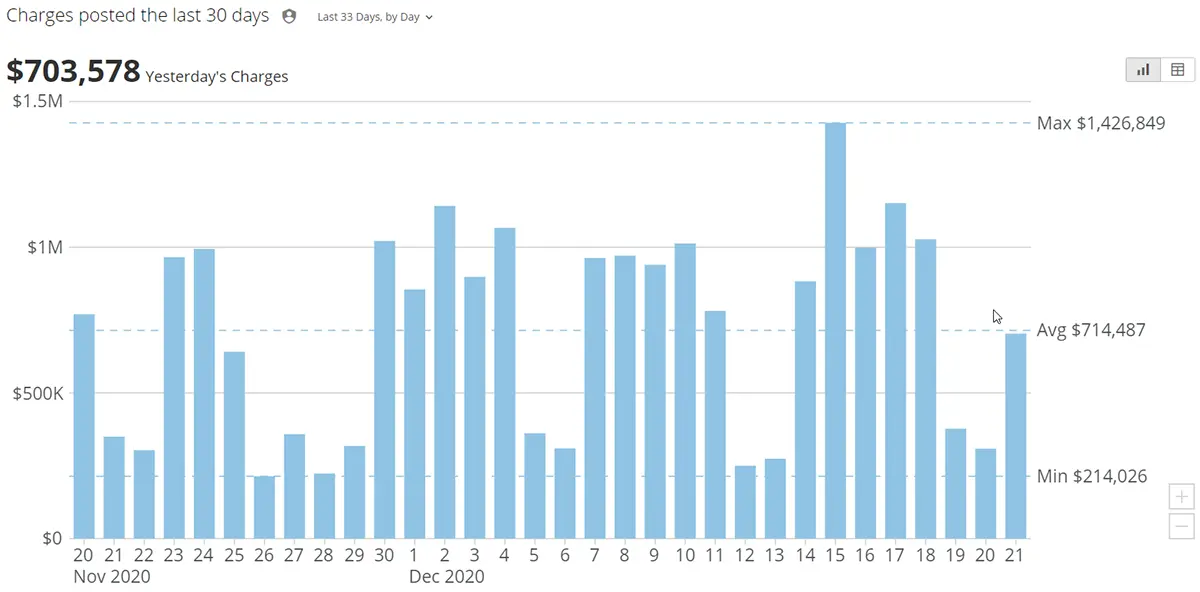
Your Daily Revenue Dashboard does the work for you!

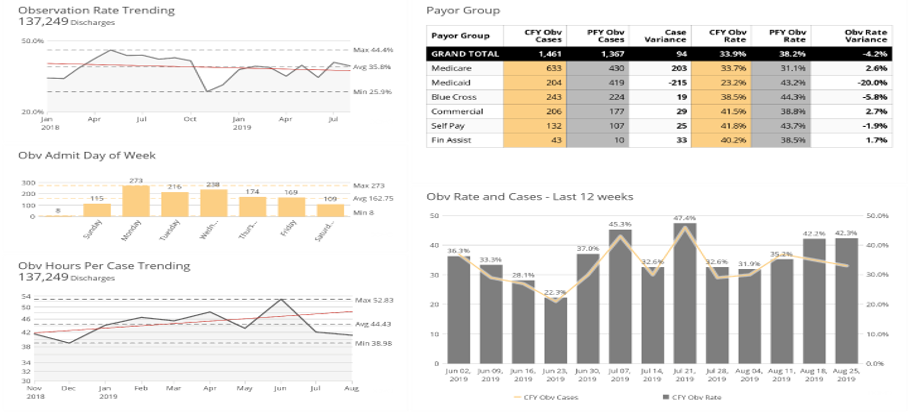
Your Observation Rate Dashboard does the work for you!
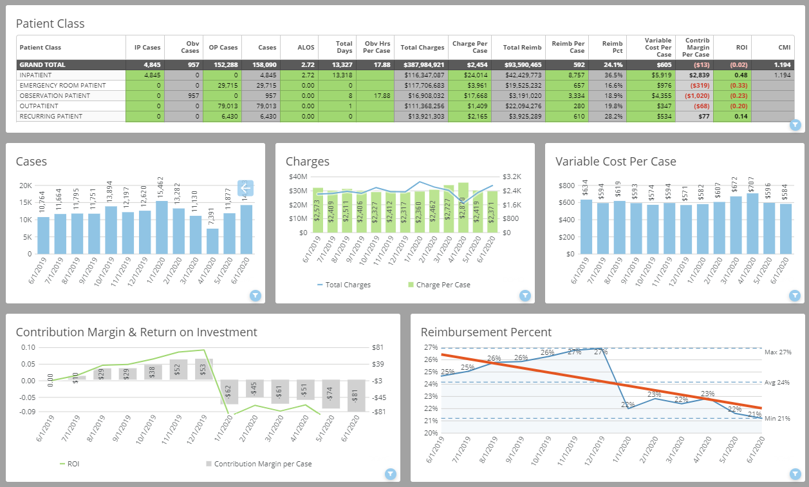
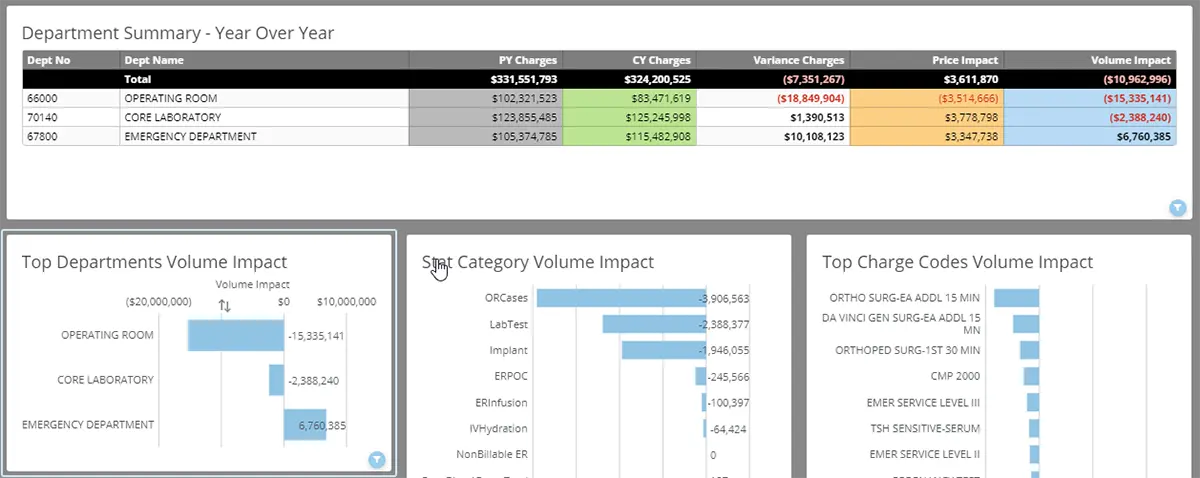
Your Revenue Impact Dashboard does the work for you!
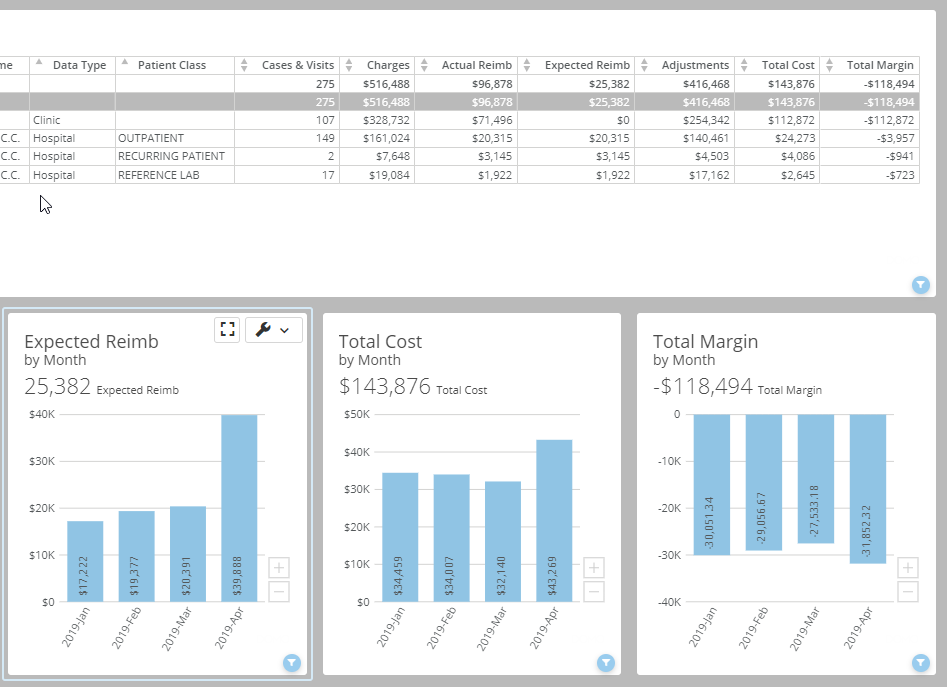
Your Hospitals and Clinics Dashboard does the work for you!
Maximize Revenue and Cost Savings in 6 Key Areas
Sixth Sense’s SMaRT Analytics platform addresses needs common to all healthcare organizations, providing you with best practice, actionable analytics in as little as 45 days.
Healthcare Executives Love SMaRT Analytics™
We are always looking for ways to improve revenue and decrease costs. I am excited to transform our analytics capabilities and for the new insights we will quickly gain. READ MORE

We are ready to embrace modern healthcare operational intelligence, bring automation to our reporting, and agility and confidence to our decision-making. READ MORE
I can pull up the application with the executives in a room and click. I don’t have to explain what the data tells them—it is just there. READ MORE

We are thrilled with the productivity project, the SMaRT Analytics platform, and the training provided by Sixth Sense. READ MORE

We really appreciate how affordable the SMaRT Analytics™ platform is given our expected ROI and how fast it will be implemented. READ MORE

Implementing SMaRT Analytics will help us make informed decisions as we navigate the challenges of upgrading our systems and processes. READ MORE

SMaRT Analytics Key Features & Benefits
-
Analytics Faster Than You Can Imagine
SMaRT Analytics replaces 40 manual hours with just 4 minutes—your productivity gains are exponential! It swiftly presents price, volume, department, procedure code, and payor mix variances, and more. Interactive features enable multilevel analysis in minutes instead of days or weeks.
-
Frees Analysts to Focus on High-Value Work
SMaRT Analytics significantly reduces your analysts' involvement in time-consuming manual data analysis, freeing up their time to focus on high-value initiatives and resulting in substantial cost savings for healthcare organizations.
-
No Data Limitations
SMaRT Analytics, a versatile cloud platform, quickly scales for master data management projects without extra hardware or software. Its adaptable data model seamlessly integrates diverse elements without constraints. Covering areas from external benchmarking to patient satisfaction, automated email delivery ensures essential analyses are easily accessible to healthcare leaders.
-
Better Results for One-Third the Cost
In as little as 45 days, Sixth Sense’s proprietary SMaRT Analytics™ platform delivers ROI with unparalleled insight into your operations, finance, physician performance, labor productivity, and more. And we do it for about one-third the cost of legacy data mining tools that don’t provide the intelligence you need for quick answers to your most pressing problems.
-
Standardized Data: Your Single Source of Truth
Our comprehensive solution establishes a standardized framework across billing systems to maintain a Single Source of Truth for your healthcare data. SMaRT Analytics ensures improved insights, efficiency, and confident decision-making, aligns maintenance incentives, enables swift acquisitions benchmarking, consistent reporting, and mitigating disputes through unified, standardized data.
-
Automated Production and Delivery
Disruptions from vacancies, holidays, and illness happen. Our platform ensures uninterrupted access to vital information. Customized dashboards are delivered to your management team, providing actionable insights through automated production and delivery, enabling confident and efficient decision-making.
-
Easy Maintenance, Long-Term Stability
In healthcare, change is driven by coding updates, physician transitions, facility expansions, and more. SMaRT Admin complements SMaRT Analytics, streamlining integration of new data, and supports extensive aggregations, allowing seamless inclusion or exclusion of recent provider, location, and service line modifications.
-
Integrated Hospital and Professional Billing
Managing billing across hospitals and professional services is complex. SMaRT Analytics solves this by integrating data at the provider level, creating a unified dashboard for comprehensive review. It automates integration of hospital and professional billing, ensuring consistency, efficiency, and cost-effectiveness in analyzing each provider's contribution.
Explore More Solutions
The state-of-the-art SMaRT Analytics™ platform, combined with decades of direct healthcare experience, enable us to build and deliver custom analytics much faster than your internal resources, which are overloaded with competing responsibilities. LEARN MORE
With our Healthcare Operational Intelligence Two-Week Assessment, choose a standard opportunity analysis, or let us explore opportunities you believe exist but haven’t had the resources to investigate. LEARN MORE
This problem equals the average margin for most hospitals: 1% to 3.5% of net patient revenue in the first year following your conversion. Learn about the Sixth Sense Intelligence 4x ROI Guarantee. LEARN MORE
Imagine your acquisition quickly integrated into a single unified platform. Our SMaRT Admin custom data standardization and enrichment engine accomplishes this in just 60 days, integrating all data sources into the SMaRT Analytics platform. LEARN MORE
Through our custom consulting services, we are here to help you discover revenue and cost-saving opportunities that most significantly impact the success of your healthcare organization. LEARN MORE


