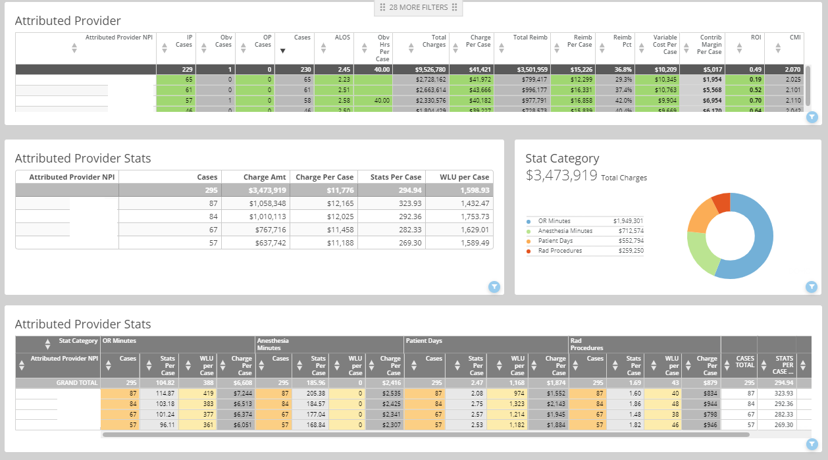
Take your performance analyses a step further with date of service charts and CPT charge links.
Service Date Analytics
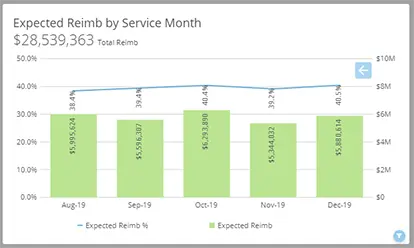
Operations leadership typically reviews clinic activity based on the posting date. SMaRT Analytics takes it a step further with our Service Date Dashboard, which provides charts based on the date of service and links actual CPT charges to payments.
Now, you can analyze account balance and reimbursement by CPT code, provider, and payor. SMaRT Analytics calculates estimated reimbursements on account balances greater than zero.
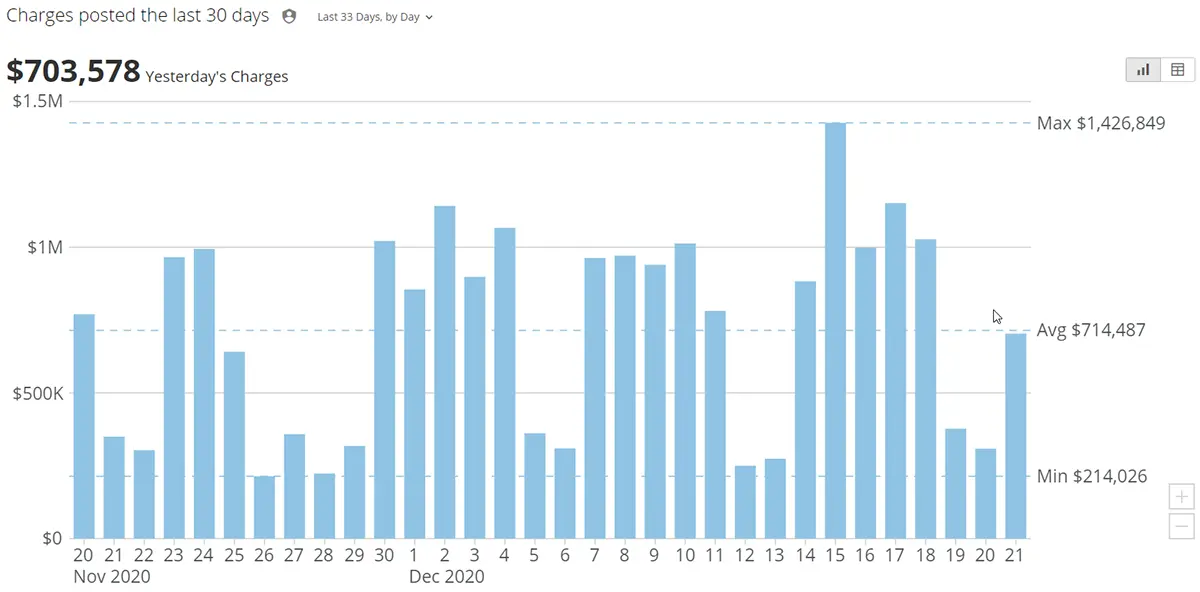
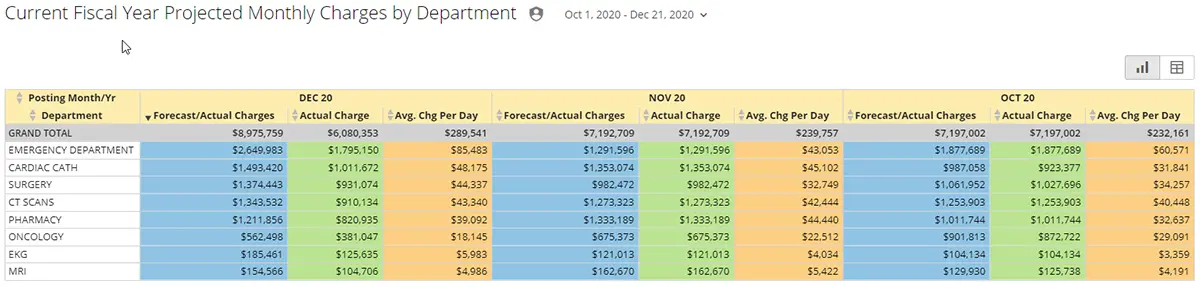
Clinic Posting Date Analytics
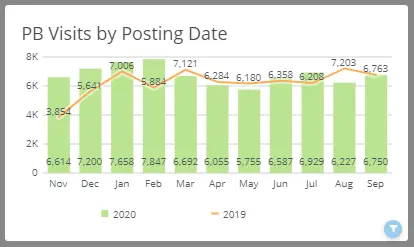
The SMaRT Analytics Posting Date Dashboard accommodates healthcare financial operations that require aggregate information that ties to accounting periods.
wRVU Analysis and Calculations
Eliminate the time-consuming, multi-step process needed to manually calculate wRVU by provider for provider productivity, compensation, and benchmarking analyses. In addition, automate the cumbersome production of wRVU provider statements, trended at the CPT® level, tied to actual patients seen, for any time period.