With SMaRT Analytics™, the operational key metrics you need are at your fingertips, delivered automatically to your inbox.
Case Mix Index / Clinical Documentation
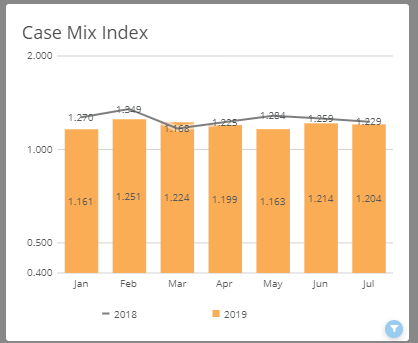
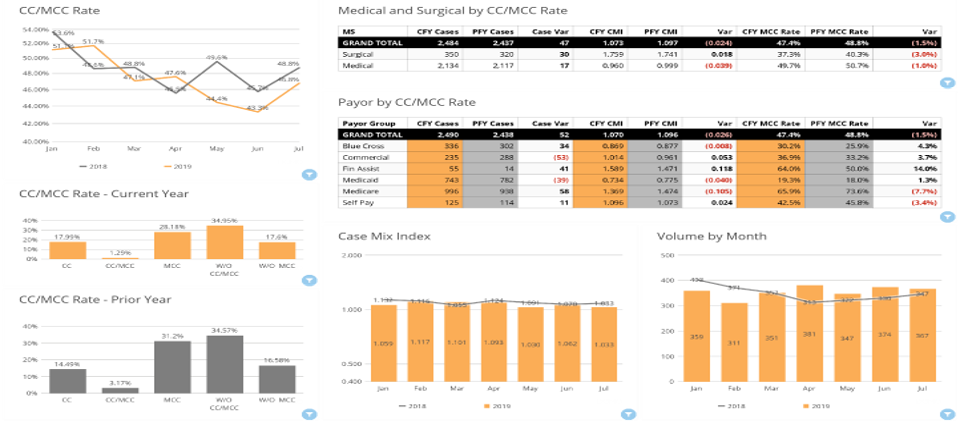
CMI impacts net revenue, so monitoring this metric helps explain some of your net revenue variability. Your CMI is not controllable — but the related CC (complication or comorbidity)/MCC (major complication or comorbidity) rate, which also impacts net revenue, is manageable through clinical documentation. As your CC/MCC rate improves, so do your quality scores.
By identifying documentation variation by provider, payor, and diagnosis, our CMI dashboard highlights best internal practices. Sharing these best practices can have a positive impact on your net revenue.
SMaRT Analytics features linked charts that trend and compare your CMI and CC/MCC rates by payor, DRG type, and provider.
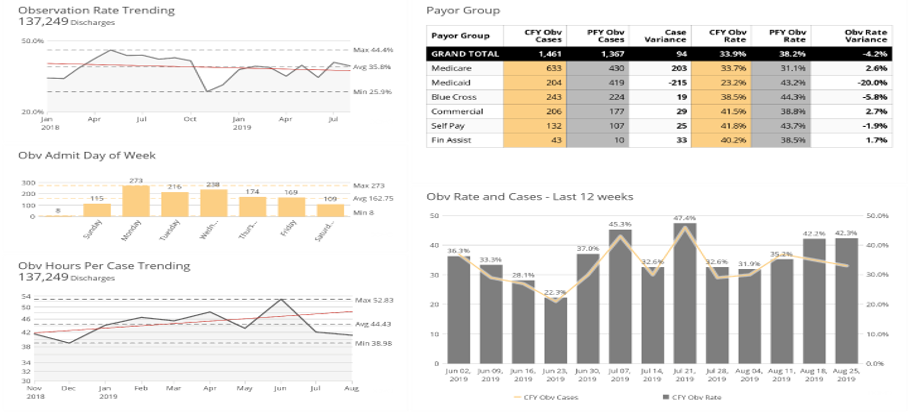
Observation Rate
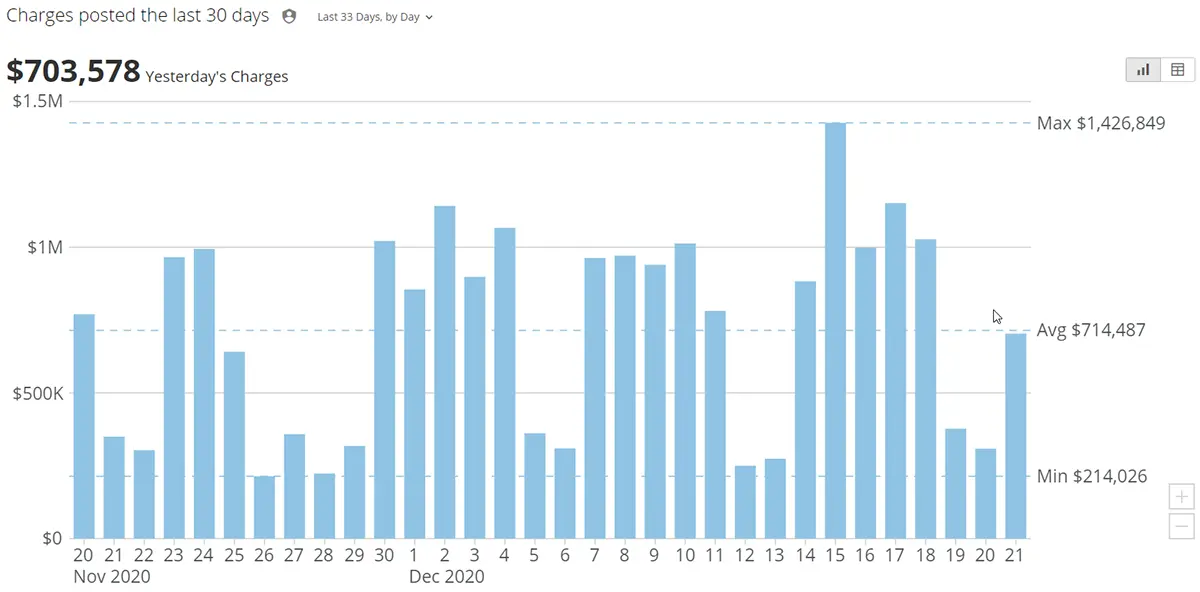
Medicare reimburses observation patients at approximately 50% of Inpatient reimbursements. Therefore, proper patient status is a critical element that impacts net revenue.
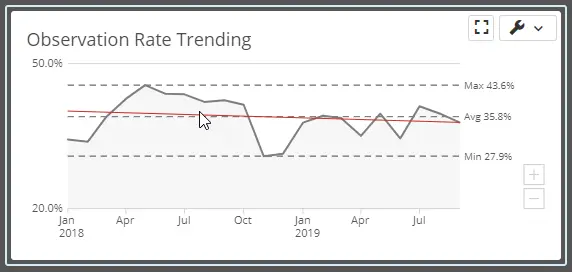
The SMaRT Analytics Observation Dashboard trends and compares cases, observation rate, and observation length of stay by payor, day of the week, diagnosis, provider, and location. These metrics identify practice variations that can lead to net revenue opportunities.
Linked Charts trend and compare the observation rate and hours by pay or day of the week, diagnosis, provider, and location.
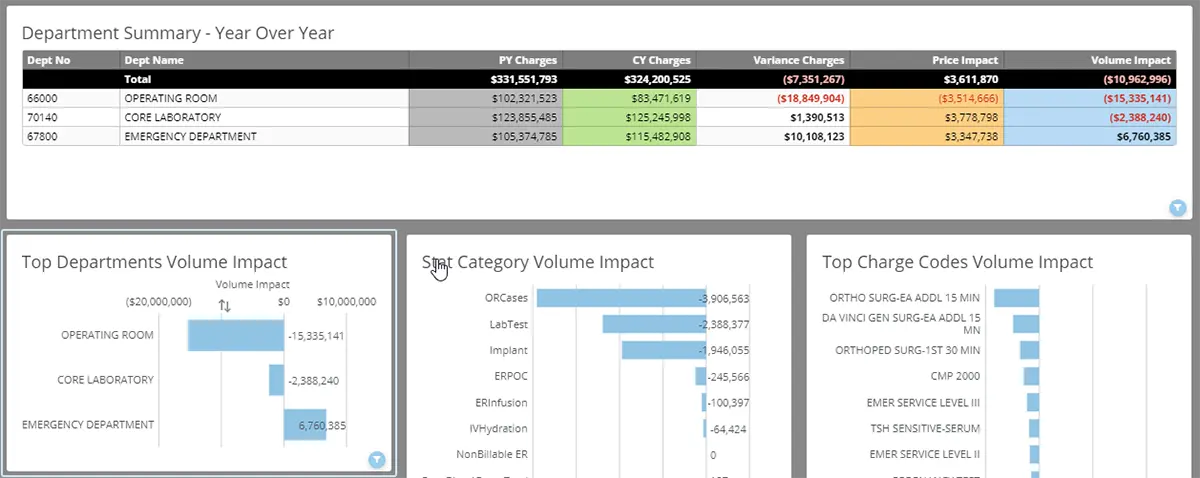
Profitability
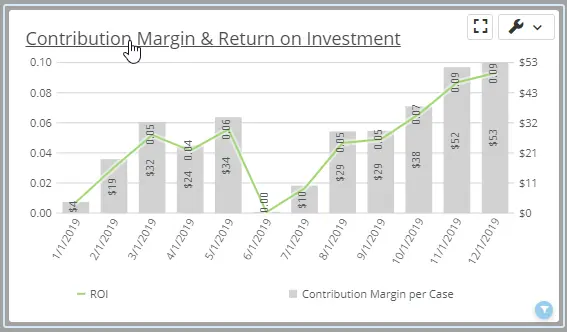
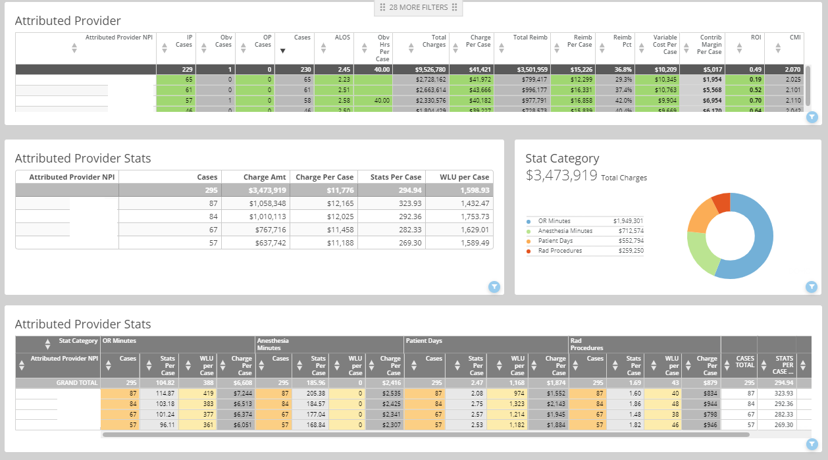
Understanding ROI is critical to knowing which are your most profitable service lines.
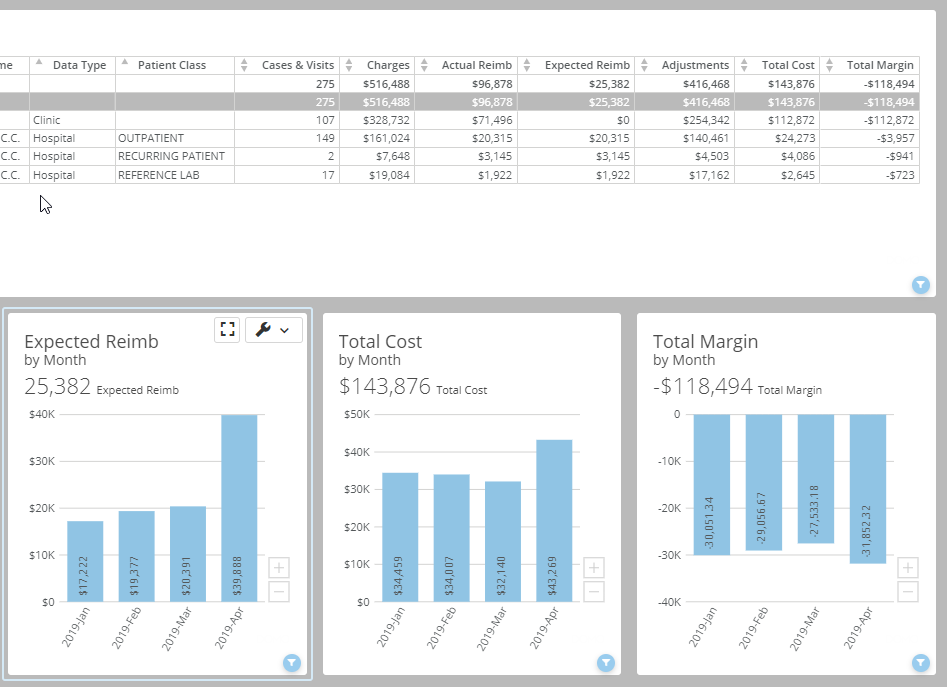
The SMaRT Analytics Profitability Dashboard summarizes profitability by service line, DRG, payor, provider, patient class, and location.
Metrics include cases, LOS, charges, reimbursement, cost, and ROI.
Over 40 linked charts calculate your return on investment by patient type, payor, DRG provider, and more.
Physician Variation
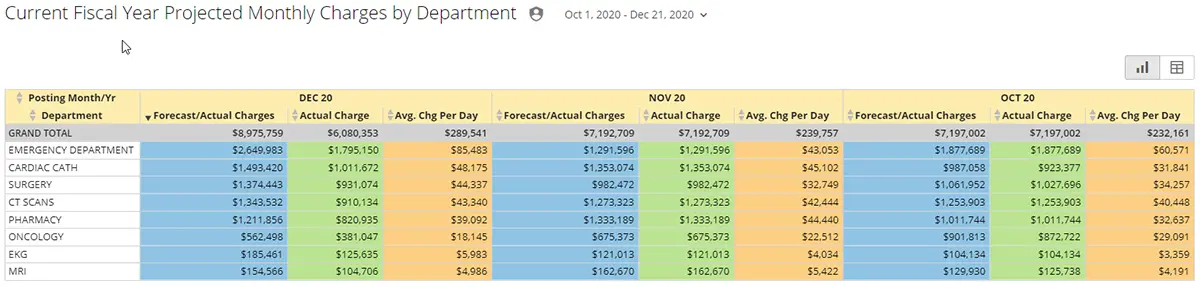
Understanding physician variation is extremely powerful in changing provider practice patterns and reducing costs. As a result, you can impact resource utilization and lower costs.
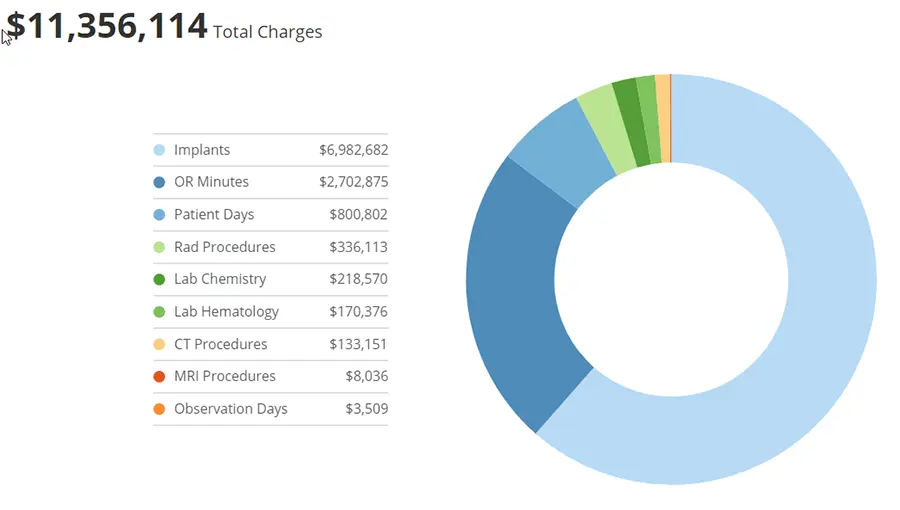
This game-changing SMaRT Analytics dashboard automates a traditionally complex and time-consuming manual analysis. The dashboard compares profitability and resource utilization by provider, diagnosis, and payor.
It is now simple to compare providers’ resource utilization by diagnosis, payor, department, and charge code. Over ten linked charts compare resource utilization and profitability by provider and diagnosis.