Search
Close this search box.

Revenue Cycle

What is SMaRT Analytics for Healthcare Operational Intelligence?

SMaRT Analytics is a software-as-service (SaaS) data visualization platform for healthcare organizations of all sizes. SMaRT Analytics standardizes and streamlines healthcare operations and financial data into a single unified source, transforming it into easy-to-understand, actionable information. This next evolution in healthcare business intelligence is a complete solution that enables healthcare leaders to quickly answer their most pressing questions and rely much less on analysts for answers.

Revenue cycle, including all activities leading to payment for services provided, from patient registration to verification of benefits to care delivery, claim submission, and reimbursement, is the lifeblood of your hospital or healthcare system.

With SMaRT Analytics, you gain the insight you need to ensure proper billing for all services provided. We configure your Revenue Cycle dashboards specifically for your organization’s needs.

EHR Conversion Revenue Leakage

When you undergo an EHR conversion or outsource your billing, how do you ensure you are now billing for all work your clinical departments perform?

Our first objective when founding Sixth Sense Intelligence was to make it easy to solve this problem.
The size of this problem equals the average margin for most hospitals! Revenue leakage accounts for 1% to 3.5% of net patient revenue in the first year following your EHR conversion.

We Find Revenue Leakage in Your Healthcare Operation, Guaranteed

We find revenue leakage in every single EHR conversion we encounter.

  • Where charge leakage occurs during conversion
  • Solutions to prevent charge leakage
  • Why outsourcing this service is cost-effective
  • Our 4x ROI Guarantee

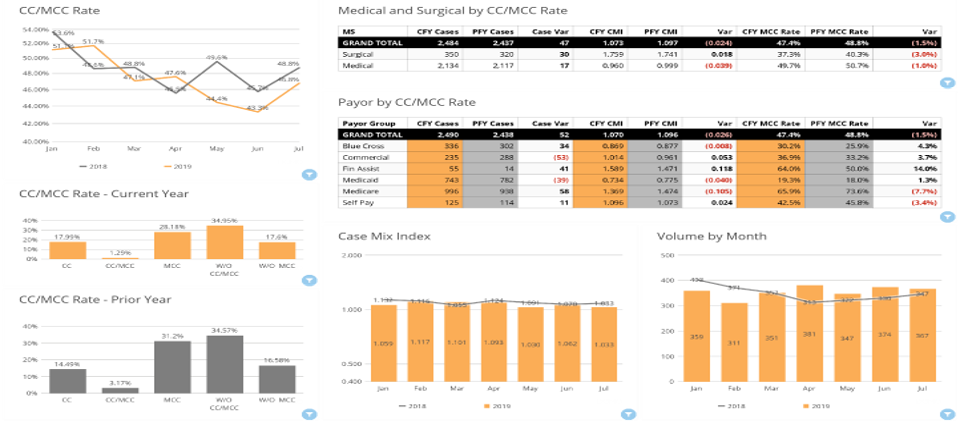
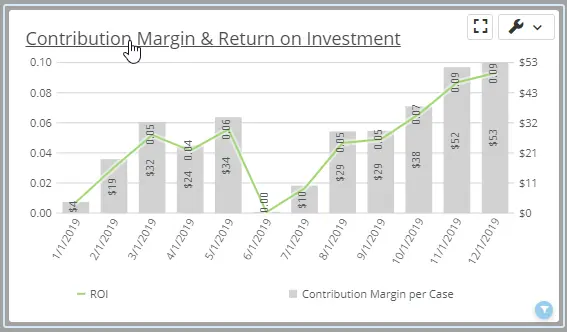
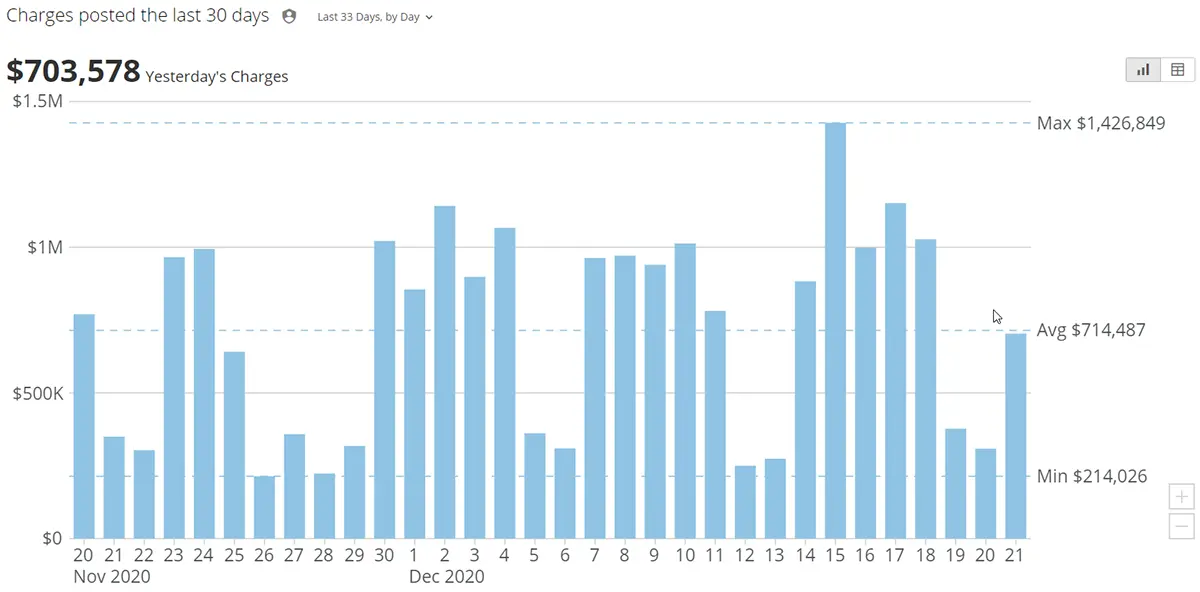
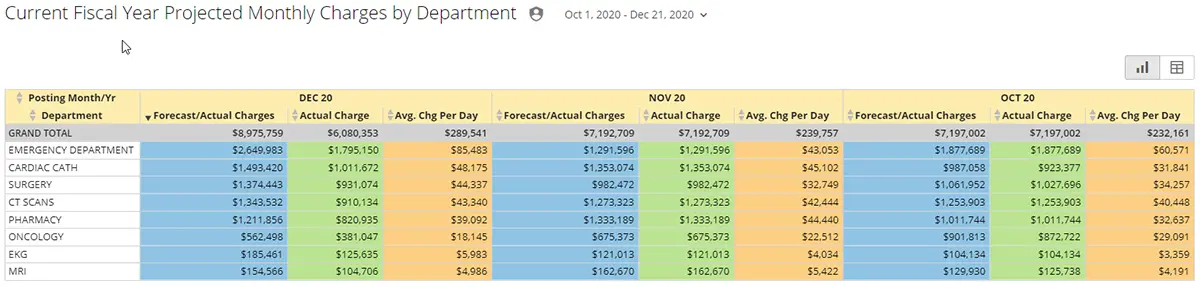
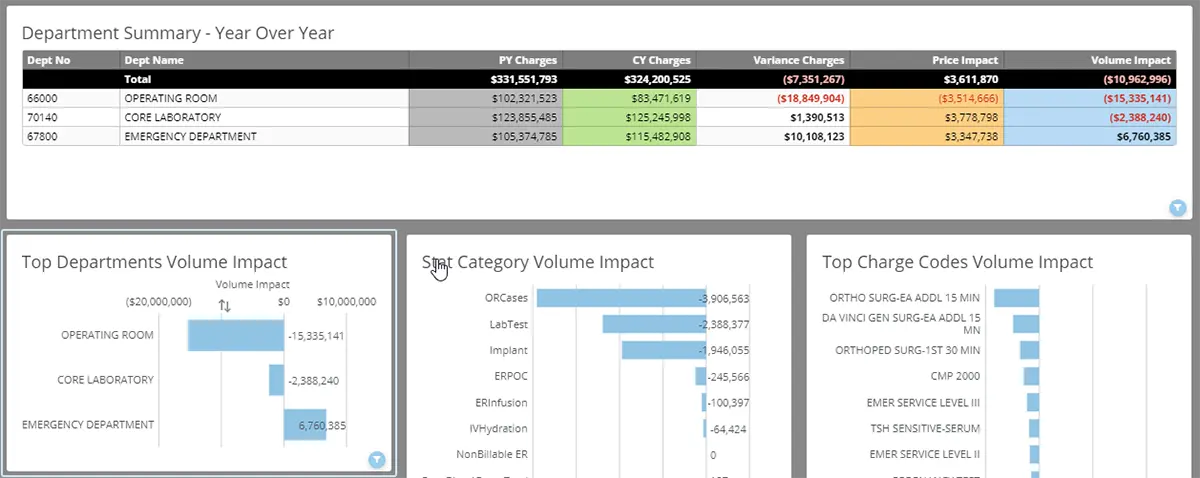
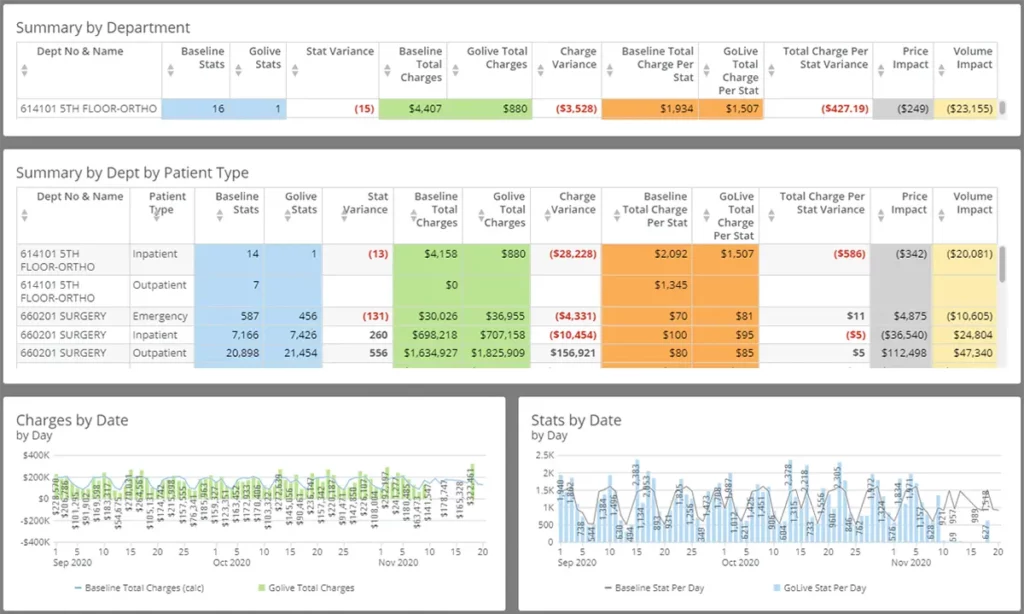
The SMaRT Analytics Revenue Leakage Dashboard includes multiple linked interactive charts to call your attention to daily charging variances from a baseline by day of the week, department, patient type, and stat name. In addition, linked charts tell you why revenue is up or down over a comparative period by breaking down the variance between price and volume.

[DOWNLOAD] Revenue Leakage White Paper

A/R Analysis and Aging

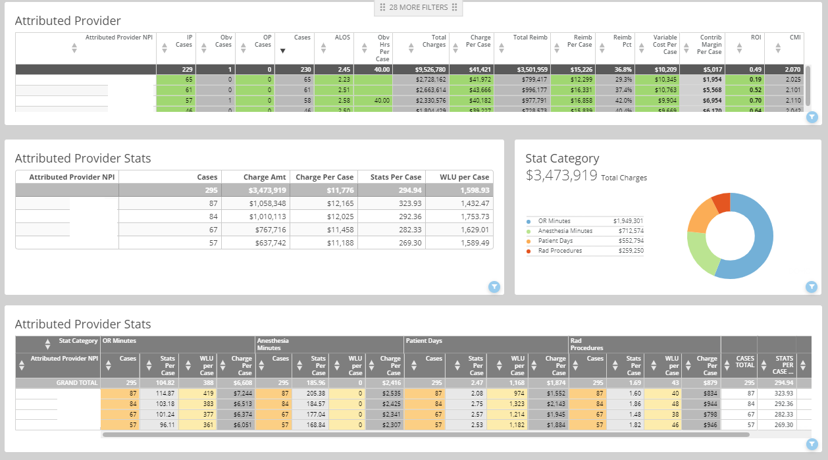
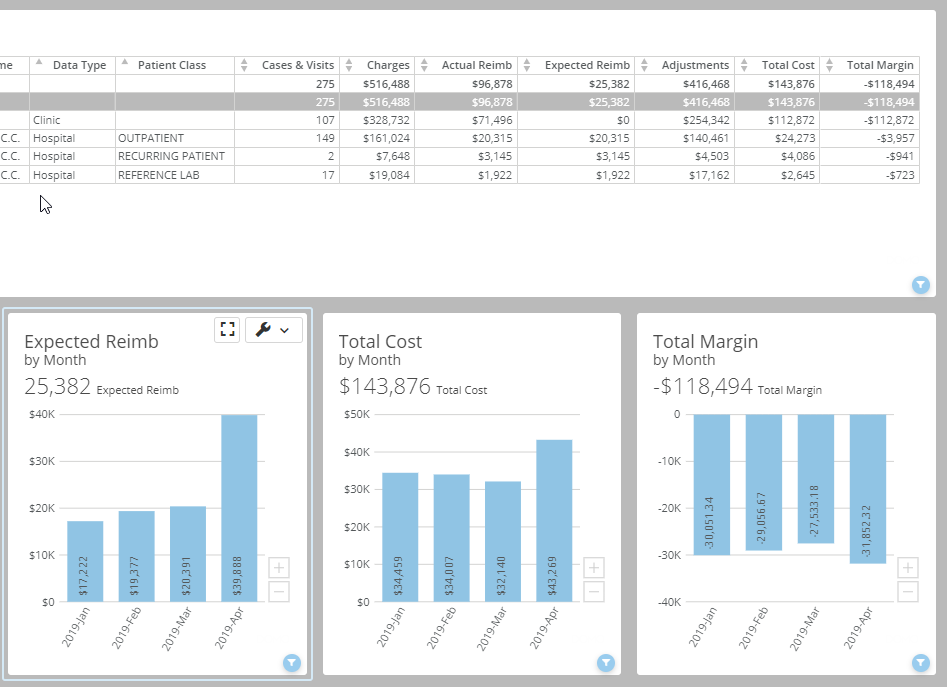
While all accounting systems have standard Aged Trial Balance (ATB) reports, they are inefficient at helping you aggregate views by payor, DRG, department, provider, etc. These aggregate views enable you to identify your revenue improvement opportunities. With our interactive dashboards, all these views are available simultaneously.

Healthcare Executives Love SMaRT Analytics™

Ask SMaRT Analytics™ Anything.

In as little as 45 days, Sixth Sense’s proprietary SMaRT Analytics™ platform delivers immediate ROI with unparalleled insight into thousands of questions all healthcare executives are asking.

Why is the case mix index shifting? Is it attributed to documentation or diagnosis?

Your CMI Dashboard does the work for you!

Case Mix Index

Which service line generates the highest ROI?

Your Profitability Dashboard does the work for you!

Healthcare Profitability Analytics

How has my payor mix changed by department, procedure code, etc. over time?

Your Revenue Trending does the work for you!

Hospital Revenue Trends Analytics Reports

What is the physician treatment utilization variation by diagnosis?

Your Physician Variation Dashboard does the work for you!

How is revenue projected to finish for the month and YTD?

Your Daily Revenue Dashboard does the work for you!

Hospital Daily Revenue Analytics Reports

Your Observation Rate Dashboard does the work for you!


How much of my revenue change is attributed to price vs. volume?

Your Revenue Impact Dashboard does the work for you!

Hospital Revenue Impact Analytics Report

What is my blended profitability by provider for hospital and professional billing?

Your Hospitals and Clinics Dashboard does the work for you!

Discover Significant Revenue and Cost Savings Today

Sixth Sense's foundational analytics address needs common to all healthcare organizations, providing you with “out of the box,” best practice, actionable analytics in as little as 45 days.