


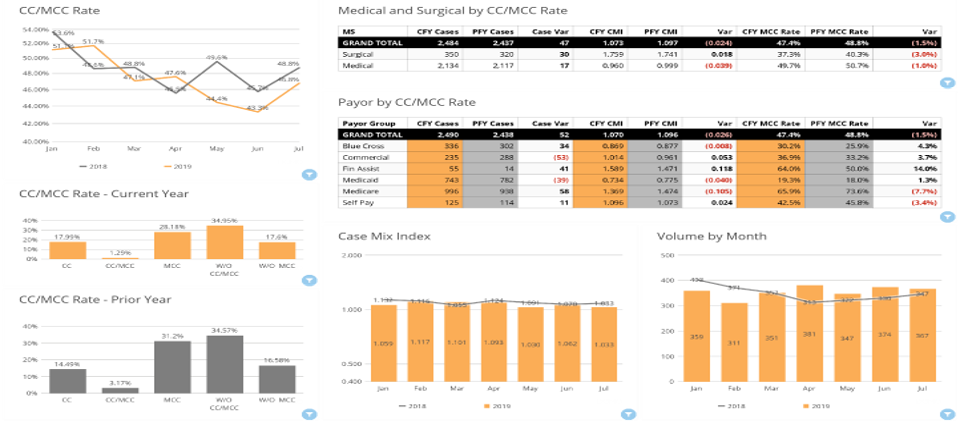
Why is the case mix index shifting? Is it attributed to documentation or diagnosis?
Your CMI Dashboard does the work for you!
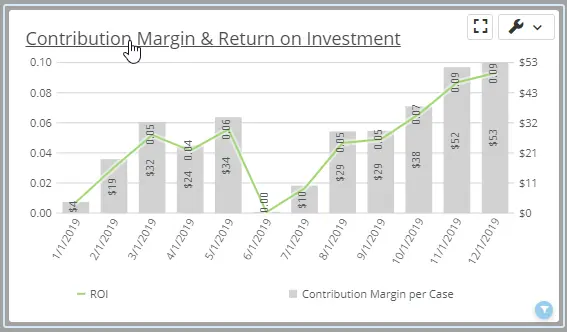
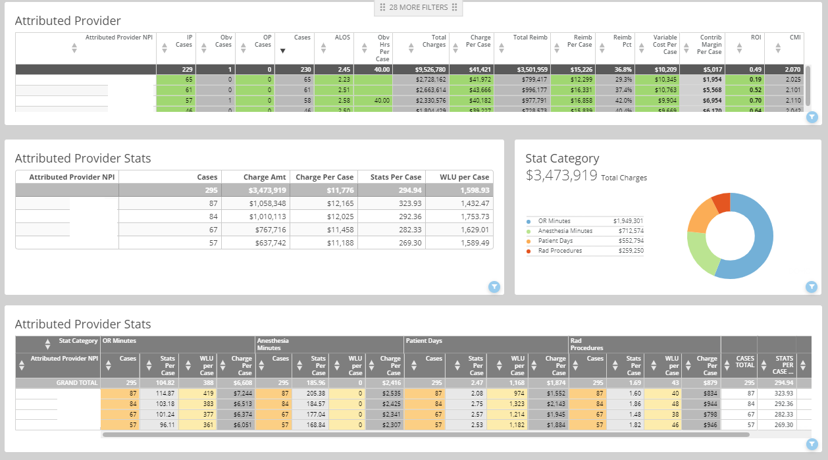
Which service line generates the highest ROI?
Your Profitability Dashboard does the work for you!
How has my payor mix changed by department, procedure code, etc. over time?
Your Revenue Trending does the work for you!
What is the physician treatment utilization variation by diagnosis?
Your Physician Variation Dashboard does the work for you!
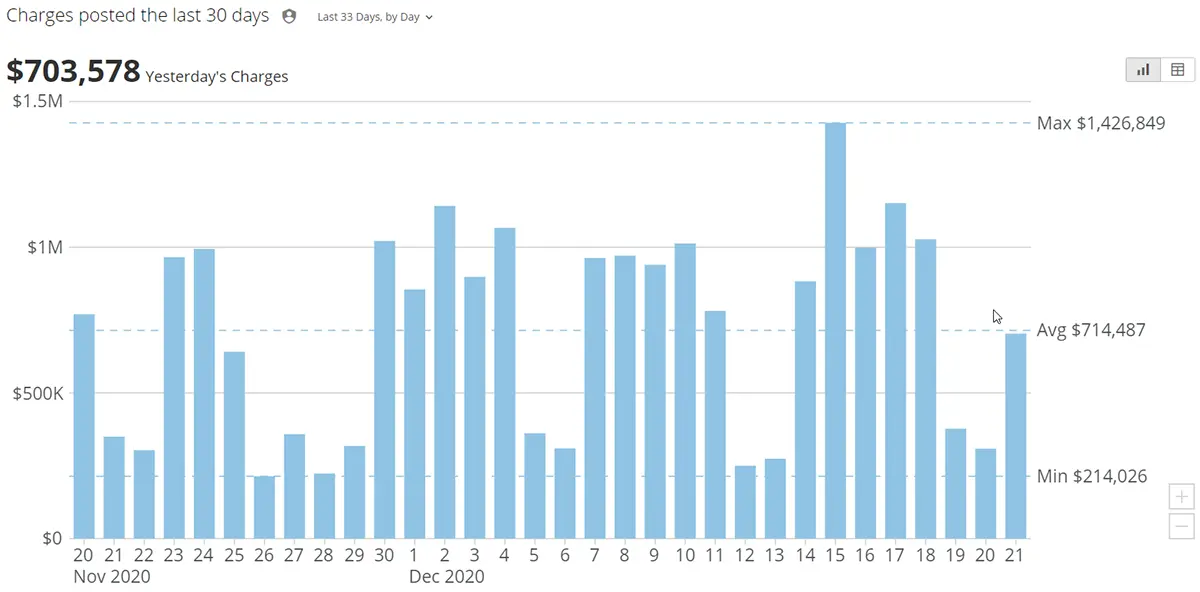
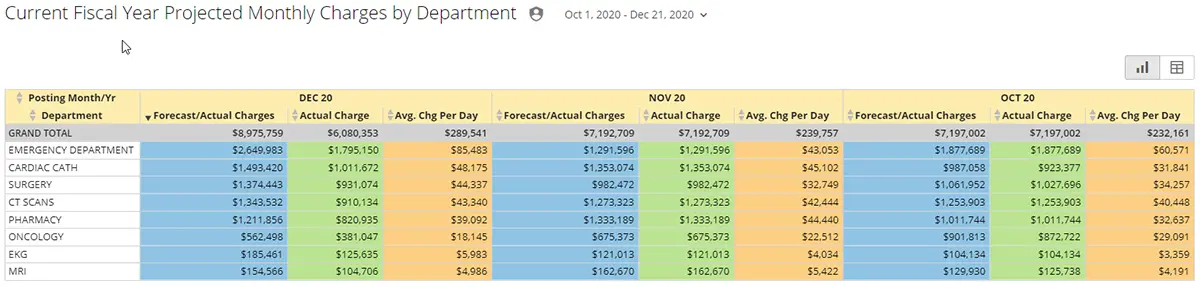
How is revenue projected to finish for the month and YTD?
Your Daily Revenue Dashboard does the work for you!
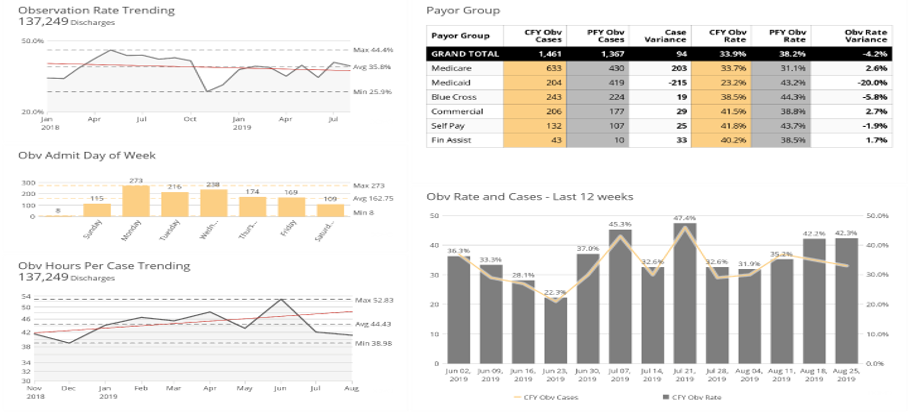
What is my observation rate by payor and provider and how is it trending?
Your Observation Rate Dashboard does the work for you!
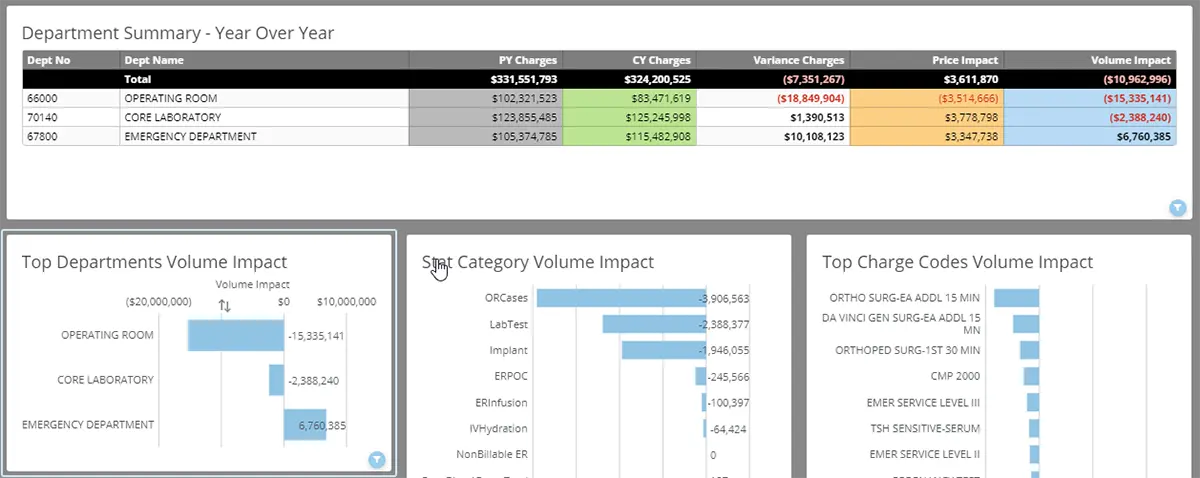
How much of my revenue change is attributed to price vs. volume?
Your Revenue Impact Dashboard does the work for you!
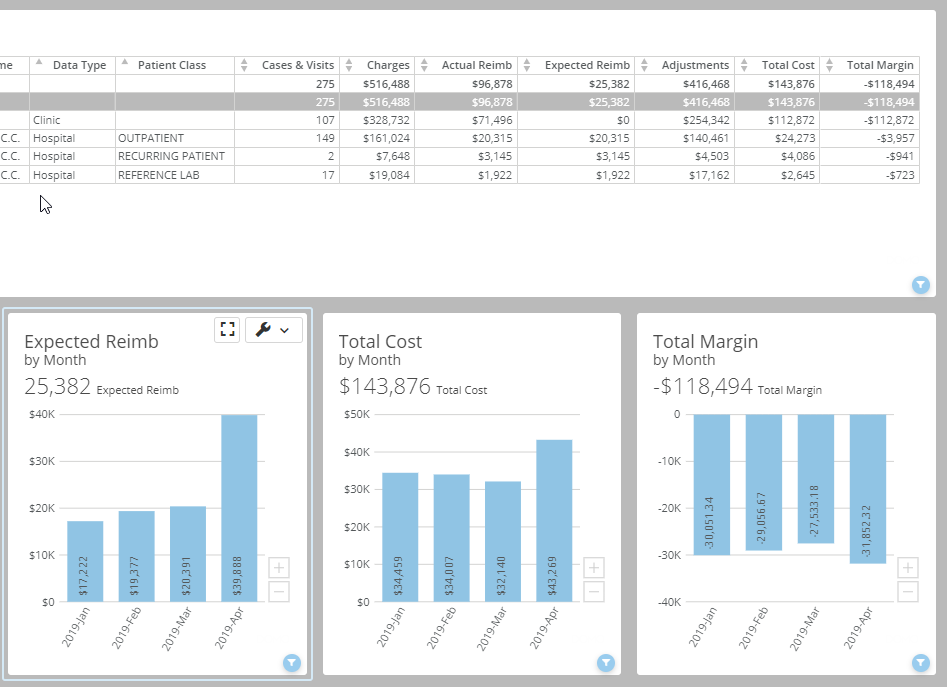
What is my blended profitability by provider for hospital and professional billing?
Your Hospitals and Clinics Dashboard does the work for you!